

![]()
Ēāæļ®öļē┤


|
|
ŌŚŗ Inbound Students
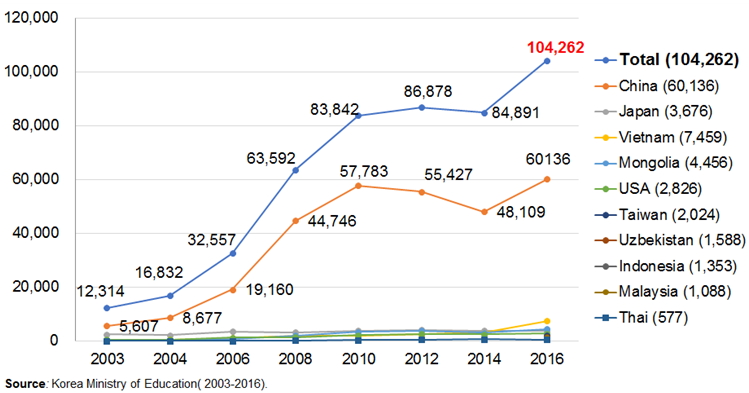
This graph includes both degree (masterŌĆÖs and doctoral) and non-degree (exchange students, language courses) inbound students. The number of inbound students has steadily increased from 2003 and reached over 0.1 million as of 2016. Chinese students account for nearly 58% of inbound students in Korea. Out of 63,000 Chinese students, about 35,000 students (55.4%) attends universities in the capital region (Seoul 42.9%, Incheon 1.7%, Kyunggi 10.8%.) Following China, Vietnam (7%) and Mongolia (4%) are the largest groups.
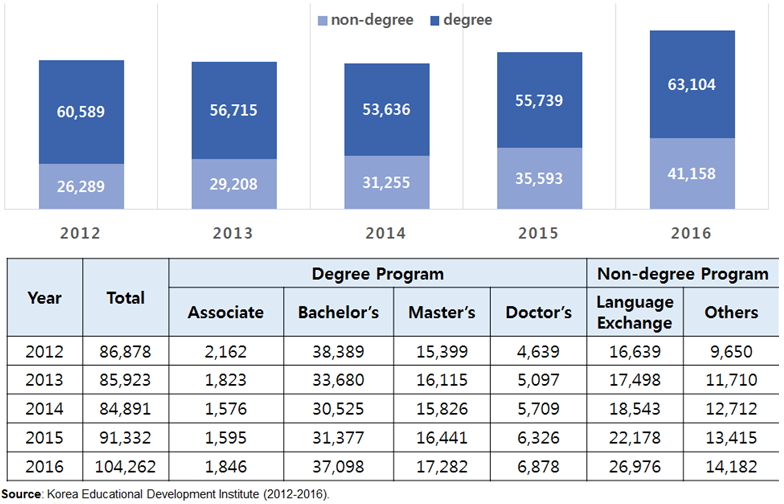
As the graph above indicates, there is a steady increase in the number of graduate school students (Master's and Doctor's) from 2012. The number of inbound students for bachelor's degree outnumbers that of Master's degree. However, there is a gradual decrease in the number of Bachelor inbound students from 2012, but slowly recovers from 2015.
ŌŚŗ Outbound Students
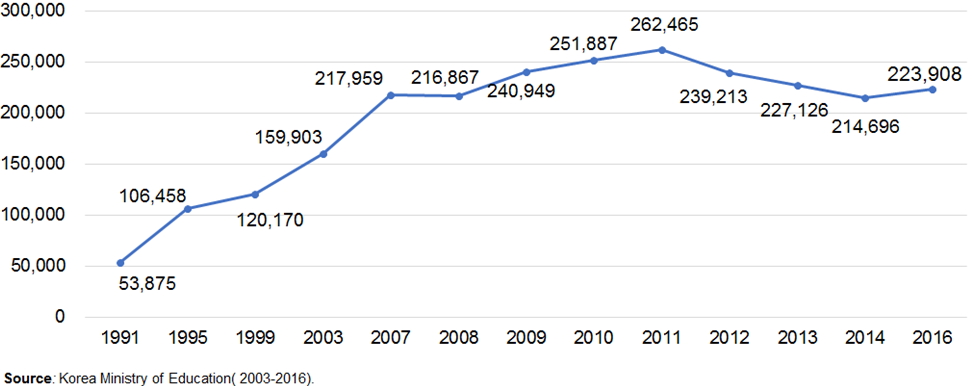
This graph shows outbound students for both degree (master and doctoral) and non-degree (exchange students, language course) outbound students. It shows a steady increase since 1991. As of 2000, the number of Korean students studying abroad sharply increased. Compared to 1991, the number of outbound students in 2011 is about 4 times bigger than that of 1991. Although there is a decrease from 2011 to 2014, the outbound number slowly recovers as of 2016.
According to OECD data in 2014, the popular destinations of outbound students of Korea was the United States (65.4%), Japan (9.4%), Germany (8.8%), United Kingdom (6.1%), France (2.8%), and Australia (2%). The data also revealed that the average age of OECD countries entering bachelor was 22, Master 28, and Doctoral 28 year-old. For Korea, the average age of entering bachelor's degree programs was 19, which is 3 years lower than the OECD average. Yet for Master and Doctoral degree, the average age was 31 and 34 relatively, which is higher than that of OECD average. Likely reasons include serving two years in the army for men, taking frequent time-offs from school due to tight employment market and attending graduate school after getting a job.